September Update: “Navigating by the Stars under Cloudy Skies”

Last month...
- On balance, US economic data has softened enough to enable the Fed to skip a rate hike at the September meeting.
- The labor market continues to loosen. The quits rate fell to 2.3%, equal to its pre-COVID level, and job openings declined from 9.58mn to 8.83mn.
- Inflation continues to moderate but shows signs of stabilizing above the Fed’s 2% target.
- However, Fed Chair Powell remains hawkish, considering there are signs that the US economy might be reaccelerating.
- The Atlanta Fed’s GDPNow 3Q forecast jumped to 5.9%.
- Aggregate income growth remains at levels commensurate with 3-4% inflation.
- Interest rates moved higher during the first half of the month but ended the month roughly in line with where they began.
- Equities sold off modestly against the backdrop of higher rates and a more-hawkish Fed.
Fed Chair Jerome Powell concluded his much-anticipated but uneventful speech at Jackson Hole, Wyoming by saying:
“As is often the case, we are navigating by the stars under cloudy skies. In such circumstances, risk management considerations are critical. At upcoming meetings, we will assess our progress based on the totality of the data and the evolving outlook and risks. Based on this assessment, we will proceed carefully as we decide whether to tighten further or, instead, to hold the policy rate constant and await further data.”
While this colorful metaphor is an important admission of the uncertainties inherent in monetary policy, it was also a subtle allusion to his 2018 Jackson Hole speech. He opened 2018 with a quote from Alan Greenspan,
“Uncertainty is not just an important feature of the monetary policy landscape; it is the defining characteristic of that landscape,” and focused the speech on u* (u star, the natural rate of unemployment), r* (r star, the neutral rate of interest), and Π* (pi star, the inflation objective).
U*, r*, Π* are the stars that central banks use to navigate monetary policy. For example, the neutral rate of interest (r*) is conceptually the real interest rate where monetary policy is neither tight nor loose and the economy is at equilibrium. If the Fed systematically underestimates r* they will set interest rates too low, and inflation will accelerate. If they systematically overestimate r* they will set rates too high and unnecessarily restrict economic growth.
Central banks around the world are questioning whether some of these stars have changed their positions in
the post-COVID sky. The Fed has been hiking the Fed Funds rate for 17 months now. Over that period, short term interest rates have risen from 0% to 5.33% – a level not seen since the late 1990s (Fig. 1). Most economists assume the “long and variable lags” of monetary policy should have kicked in by now, but — aside from highly interest rate sensitive sectors — the US economy appears to be picking up steam instead of slowing down. Powell doesn’t know if r* has risen or if he just needs to be patient.
Fig 1: Fed Funds Effective Rate

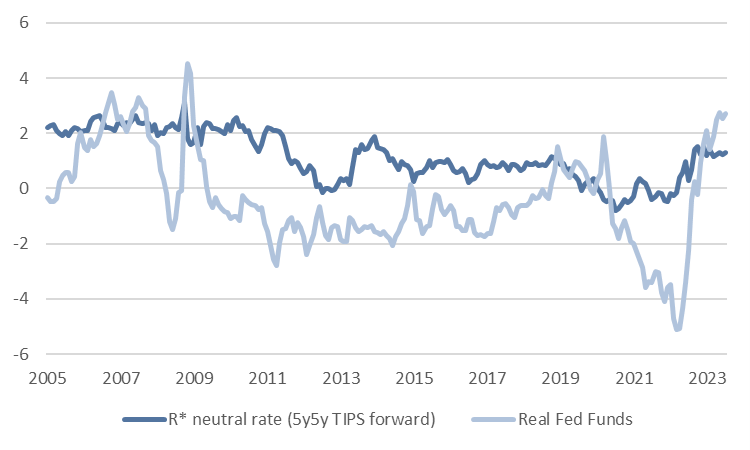
A few academics have attempted to measure r*, but the bond market itself provides a window into expectations. For example, the “5-Year, 5-Year TIPS forward rate” is the interest rate the bond market expects
on a 5-year Treasury Inflation Protected Security (TIPS) five years from now. Using this rate gets us out of the short-term minutia and provides a window into market expectations once the current storm has passed.
In August 2018, the market priced the 5y5y TIPS forward rate at 0.8%. Today, it is at 1.7% (Fig. 2). Yes, the skies are cloudy, but it should be increasingly clear to the Fed that (1) the stars have changed their positions and (2) monetary policy is currently tight since the inflation-adjusted Fed Funds rate is above r*.
Fig 2: Monetary Policy is currently tight
Pensions Are Overfunded (and You Might Be Too)
The largest corporate pension plans have been underfunded, on average, since the dot com bubble popped, but the recent jump in interest rates and recovery in equity markets has pushed their funded status into
positive territory. The Milliman 100 Pension Funding Index is currently at 1.0359, indicating that the top 100 corporate pensions are 3.59% overfunded versus their liabilities.
Fig. 3: Milliman 100 Pension Funding Index

How is this possible, considering that portfolio values are still 10% off their 2021 high-water marks? The answer is that pension liabilities have fallen even further than asset values.
Assume, for example, that a pension owes its beneficiaries $100 per year for the next 20 years if the pension “discounts” those payments at 2.25% (a reasonable discount rate during 2020 and 2021 when the US 10-year
Treasury yield was south of 2%) the current “cost” of those liabilities would be $1,560. It would be underfunded if the pension had $1,000 in its coffers. If it had $1,700 it was overfunded. Most were underfunded by 20%.
Fast forward three years and discount rates have risen along with interest rates. Now that the 10-year Treasury yield has moved north of 4%, a reasonable discount rate is around 5.25%, and the cost of the same
liability stream has fallen to $1220. A 20% funding deficit has become a 3% surplus.
Most pensions that are overfunded will do something very reasonable: sell all of their risky assets and buy a bond portfolio that matches their future liabilities. They have no reason to take additional investment risk —
their liabilities are fully funded and pensions don’t bequest assets — so there’s no reason to keep going.
Families face a much fuzzier version of pension math (among other issues, we face longevity risk, uncertainty around annual spending, and inflation risk), but the concept is worth considering. In mid-2020, a family needed $10.5mn to fund a 30-year $500k per year retirement assuming a 2.25% discount rate. The same retirement costs $7.5mn at today’s discount rates, potentially freeing up $3mn in assets for enhanced spending,
charitable gifting, or to use as a future bequest.
Disclosures & Important Information
Any views expressed above represent the opinions of Mill Creek Capital Advisers ("MCCA") and are not intended as a forecast or guarantee of future results. This information is for educational purposes only. It is not intended to provide, and should not be relied upon for, particular investment advice. This publication has been prepared by MCCA. The publication is provided for information purposes only. The information contained in this publication has been obtained from sources that
MCCA believes to be reliable, but MCCA does not represent or warrant that it is accurate or complete. The views in this publication are those of MCCA and are subject to change, and MCCA has no obligation to update its opinions or the information in this publication. While MCCA has obtained information believed to be reliable, MCCA, nor any of their respective officers, partners, or employees accepts any liability whatsoever for any direct or consequential loss arising from any use of this publication or its contents.
© 2024 All rights reserved. Trademarks “Mill Creek,” “Mill Creek Capital” and “Mill Creek Capital Advisors” are the exclusive property of Mill Creek Capital Advisors, LLC, are registered in the U.S. Patent and Trademark Office, and may not be used without written permission.