Q3 Quarterly Outlook: Hike, Pause, Cut!

Economists and forecasters have recently done a lot of hand-wringing around Fed policy. Going into
the June FOMC meeting, opinions ranged from hik- ing 50bps to a 25bps cut. The Fed ended up meeting market expectations by pausing rate hikes while (1) signaling two additional hikes by the end of the year and (2) marking their projections for economic growth and inflation meaningfully higher.
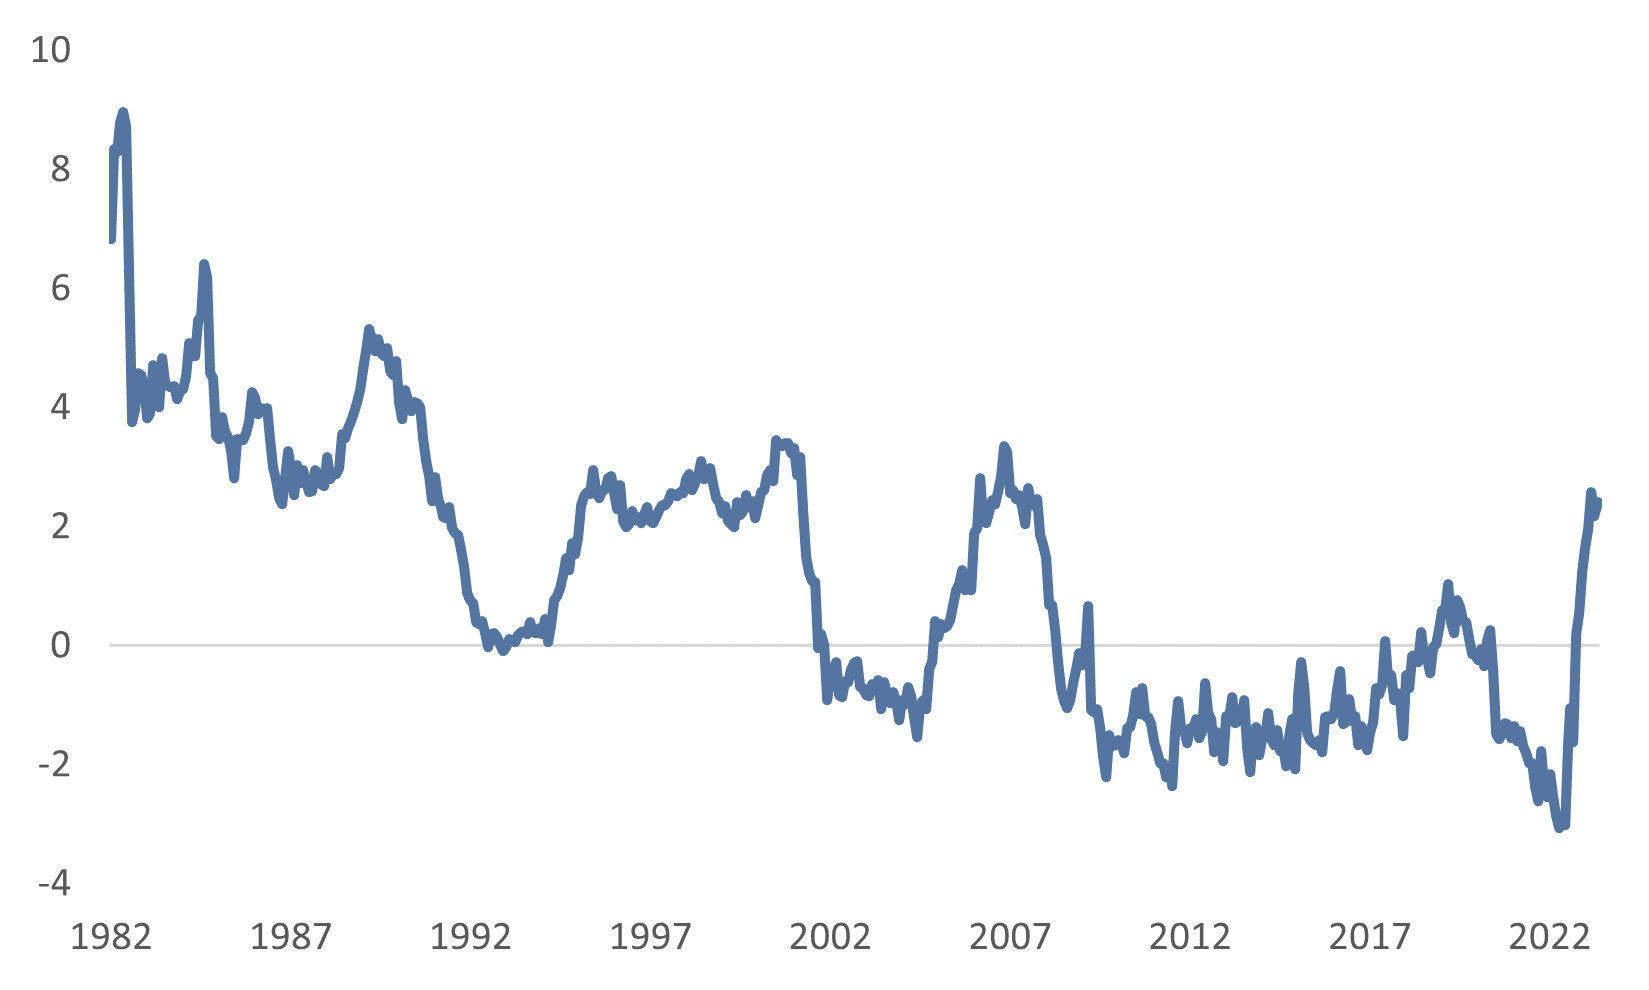
In our opinion, the specific path of Fed policy over the remainder of the year is less important than the simple recognition that, after spending two years behind the curve, the federal funds rate is finally within a range that would be considered neutral based on commonly accepted policy rules, and the inflation-adjusted fed funds rate is about as high as it has been since the Global Financial Crisis (Fig. 1).
Fig. 1: Monetary policy is tighter than it has been since 2007
Inflation-adjusted fed funds rate
Absent exogenous shocks to the system (a spike in oil prices, systemic banking failures, etc.), monetary policy moves going forward will be focused on fine-tuning policy based on incoming economic data. The market-implied path for short-term interest rates currently indicates the Fed will hike one more time in July and then cut the fed funds rate back to today’s level by the end of the year (Fig. 2). We wouldn’t read too much into market expectations for rate cuts. Market pricing has underestimated Fed policy through this entire cycle, and if inflation remains above target (Fig. 3), we shouldn’t expect significant rate cuts from the Fed.
Fig. 2: Market expectations are dovish relative to the FOMC
Market-implied fed funds rate path

Fig. 3: Inflation remains elevated
Consumer Price Index ex Food and Energy (3-month annualized)

Soft landing, hard landing, or no landing?
We’ve published a chart of aggregate private payrolls many times over the last two and a half years (Fig. 4). We view aggregate payrolls as an important indicator for inflation and growth because they provide a timely proxy for the nominal gross domestic product (NGDP). The US economy can only expand so fast in real terms. It takes time to permit and build new businesses to expand capacity. If income growth exceeds the top-line growth rate for the economy, the difference will show up as inflation (too much money chasing too few goods).
Aggregate incomes grew at 4.5% between 2011 and 2019. Demand-focused stimulus pushed aggregate income growth significantly higher during COVID, but it has been slowly declining for the last two years. While the year-over- year growth rate remains a bit above the long-term average commensurate with 2% inflation, the previous few monthly readings have been right in line with a target inflation rate of about 2%. Several more months of similar data will be welcome confirmation that the economy is back in balance.
We’ll also watch aggregate payrolls more intently than real GDP growth to indicate potential economic and market downside risks. It is very possible that we could have a recession, defined as a decline in real GDP growth and/or an increase in the unemployment rate of 0.5% or more, without significant damage to financial markets, businesses, or households — assuming aggregate payrolls do not decline. Suppose aggregate payroll growth remains flat or positive (even if it drops in inflation-adjusted terms). In that case, households won’t experience a cut in the dollars they take home each month. They can pay their mortgages, car loans, credit card bills, and other expenses. Corporate earnings would remain flat to positive in such an outcome. It would be an unusual recession for the US, but one that is looking more and more likely. Aggregate incomes (NGDP), not real GDP, are the indicator to watch for markets.
Fig. 4: Aggregate payroll growth continues to decline
US Index of Aggregate Weekly Payrolls (Total Private)

The Powell trade
Fed Chair Jerome Powell at the press conference on June 14:
“And…actually, you know, since we’re probably going to — we’re having real rates that are going to have to be meaningfully positive, and significantly so, for us to get inflation down, that probably means — that certainly means that it will be appropriate to cut rates at such time as inflation is coming down really significantly. And, again, we’re talking about a couple years out.”
A higher-for-longer scenario implies an environment that will be fine for equities, challenging for fixed income, and supportive of alternative strategies that offer a “cash + credit spread” or “cash + risk premium” return profile.
Breaking this view down a bit, higher for longer will be rea- sonable for equities because it implies an environment of supportive economic growth and inflation at or above target. Higher bond yields can be a headwind for the equity market, but we believe earnings will have a bigger impact than rates now that we are past the initial rate shock.
On the other hand, high-quality bonds will face a headwind as the market prices out rate cuts and longer-term inter- est rates modestly rise. Again, we don’t expect a replay of 2022, but longer-term rates should drift higher over the next 12 months if Powell gets his way.
Finally, the “Powell trade” appears to be a strategy that offers a cash + credit spread or cash + risk premium payoff profile. He’s telling us to expect short-term rates to stay high and the environment to remain supportive of risk assets. We prefer certain types of private lending and absolute return strategies to gain this type of exposure because, while a short- duration, high-yield position would fit this criterion, spreads within public credit remain relatively modest (Fig. 5).
Fig. 5: High yield spreads are near their long-term average
Bloomberg US Corporate High Yield Average Option-Adjusted Spread

Low correlations
We’ve written quite a bit about the concentrated returns in US equity markets this year. Performance broadened in June, but mega-cap tech — and particularly a small subset of mega-cap tech — remains the primary driver of US market performance year-to-date.
There are a few mid-to-late 1990s analogies that we can draw upon. Then, as now, the Fed had mostly completed a hiking cycle with economic growth intact. We had internet hype then versus artificial intelligence hype today. We’re once again experiencing exaggerated moves in the relative market-cap of mega-cap growth versus the rest of the market (Fig. 6). We had large companies trading at eye-popping 10x revenue or more then, as we do again today.
Market participants also expect continued dispersion be- tween stocks in the S&P. The CBOE Implied Correlation 1-Year Index, which is an estimate of the expected average correlation of the stocks that comprise the S&P 500, has fallen to an all-time low (Fig. 7). There are a couple of areas we will be watching intently if the low correlation environment persists:
- Active management: Many active equity managers pointed to high correlations between stocks as a reason for their underperformance post–Global Financial Crisis, but all indications we’ve seen this year indicate active management is struggling overall. High intra-market correlation is a double-edged sword, but it should create opportunities for active managers who can take advantage of it.
- Direct indexing: Direct indexing is a strategy that at- tempts to track a market index while generating tax losses for the investor. The current environment could be challenging for some direct index providers and result in increased tracking errors within those portfolios. We intentionally focus on periods like the current one in our evaluation of direct indexing providers and are comfortable with our partners’ ability to manage through this period effectively.
Market pricing has under- estimated Fed policy through this entire cycle, and if inflation remains above target, we shouldn’t expect significant rate cuts from the Fed.
Fig. 6: Mega-cap growth is nearly 30% of the US market
Mega-cap growth / total market cap
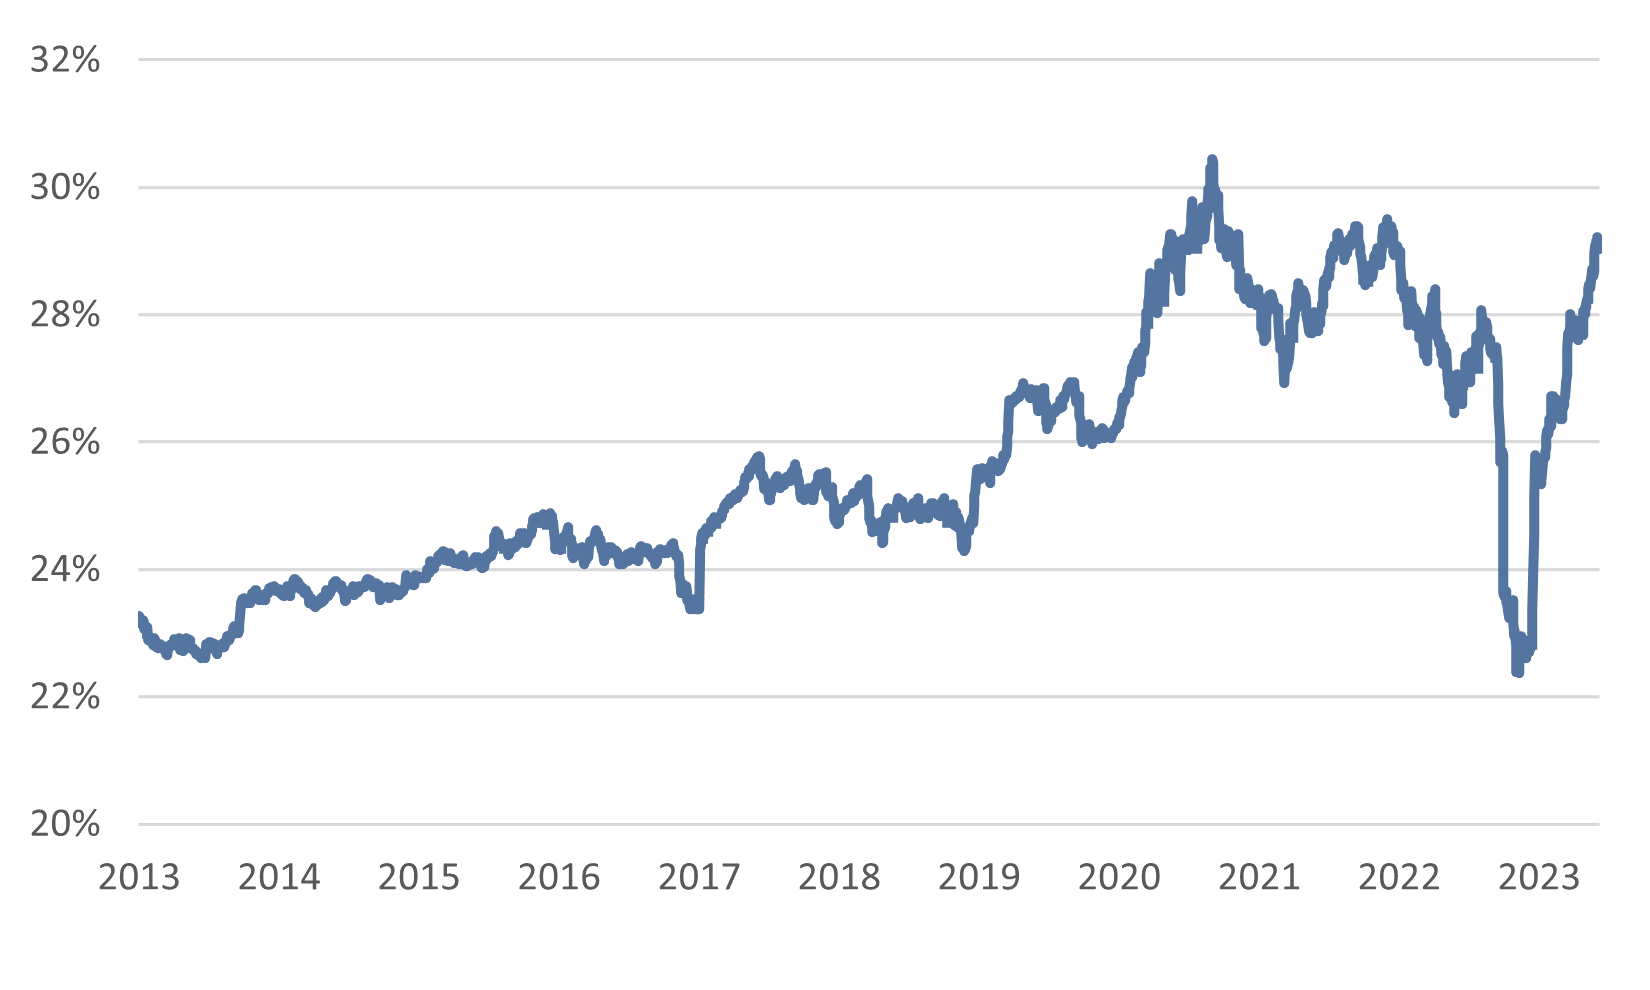
Fig. 7: Correlation within equity markets is at an all-time low
CBOE 1-Year Implied Correlation Index

High correlations
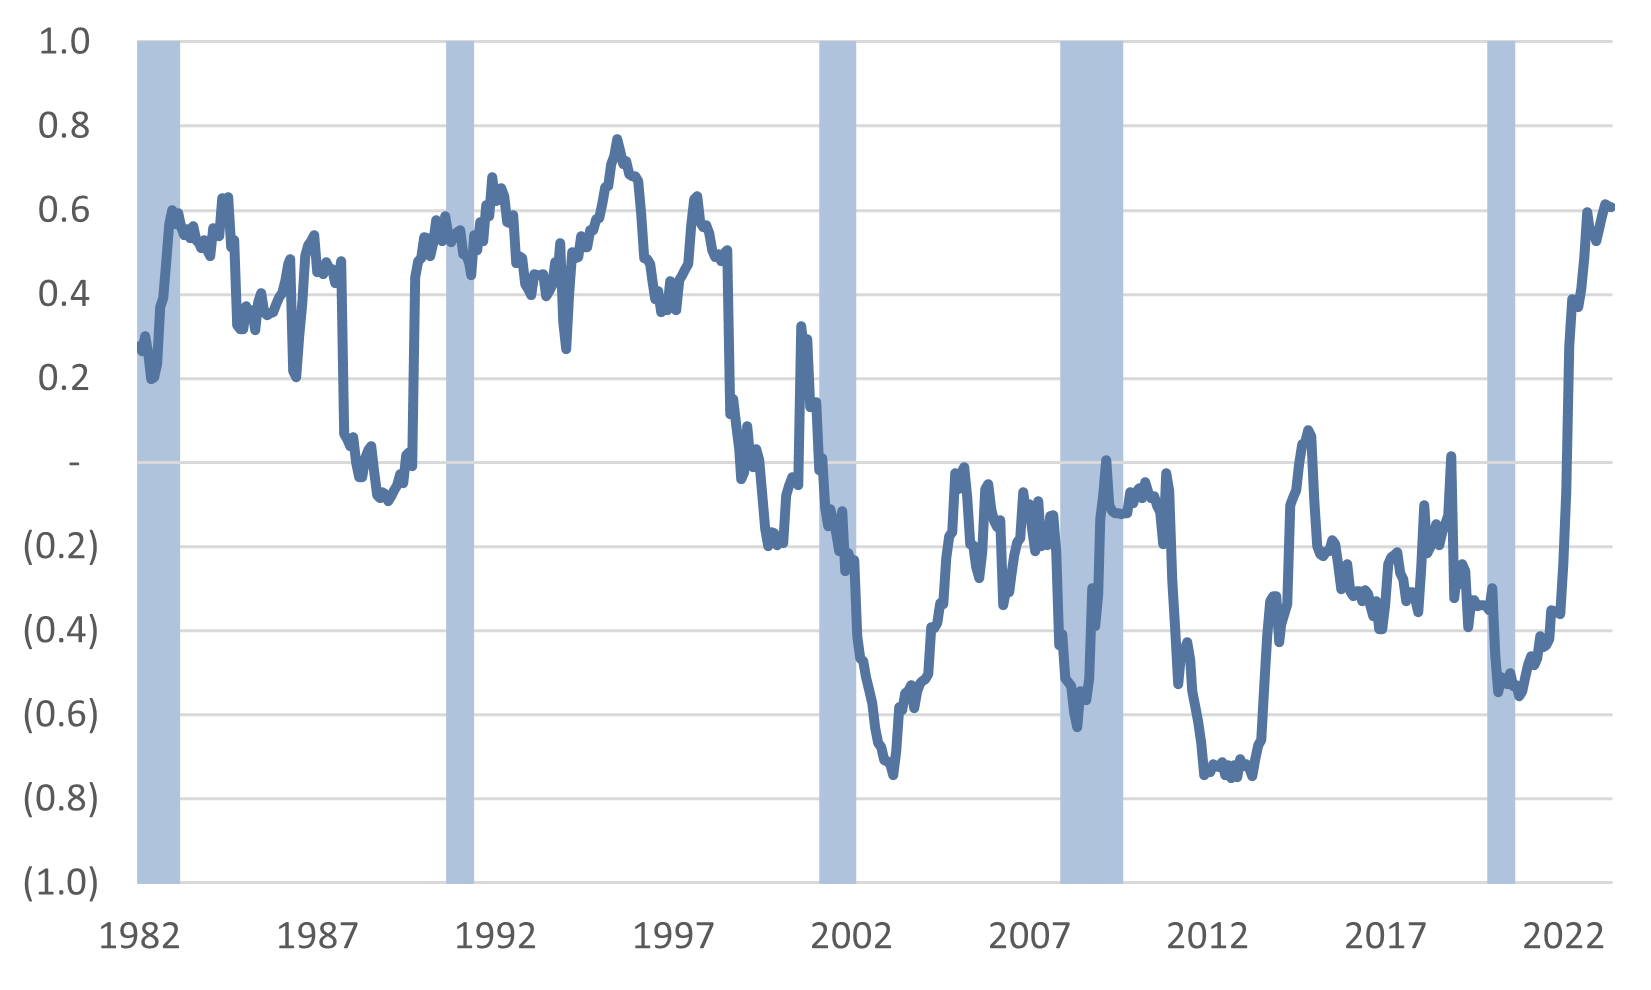
In January, we flagged a potential structural shift in markets. The correlation between stocks and bonds, which has been mostly negative since the dot-com bust in 2000, was headed back to positive territory. Since then, the correlation between stocks and bonds has continued to rise and is firmly back to the type of regime we experienced pre-2000 (Fig. 8).
Fig. 8: Stock/bond correlations have jumped post-COVID
24-month rolling correlation, S&P/Treasury Bonds
Our observation around correlation is just that, an observation, not a forecast. However, we believe a likely change in the future response function for monetary and fiscal policy to a crisis might be responsible.
On June 16, former Federal Reserve Vice Chair Richard Clarida said:
“We think we’re going to be in a world in which, at the margin, there’s probably going to be less policy sup- port provided in economic downturns than we’ve seen… We’re seeing some early evidence of what we call (quantitative easing) fatigue.”
Between 2000–2020, monetary and fiscal policy responded to every downturn with the same playbook: lowering interest rates and increasing fiscal spending. These policy reactions became more extreme over time, but the result was always the same. A sell-off in equities was typically accompanied by accommodative monetary policy and stimulative fiscal policy. Accommodative monetary policy led to lower inter- est rates and positive fixed income returns, which protected portfolios and enabled investors to rebalance from bonds to stocks. Stimulative fiscal policy pushed the economy out of recession, resulting in robust equity market recoveries.
As Clarida points out, policymakers simply cannot provide the same level of policy support during downturns as they have in the past. After 30 years of providing abundant liquidity, the Federal Reserve once again must consider inflation in its response to economic or market stress. Fiscal policy will be constrained as well. Current status quo fiscal policy for the US would have been considered emergency-level deficits by any historical gauge. The political will and fiscal capacity to add to those deficits during a downturn are uncertain at best.
In addition to driving higher portfolio volatility, it is reasonable to believe declines in plain vanilla 60/40 stock/bond portfolios could be deeper and longer in an environment of fiscal restraint and two-sided monetary policy than investors experienced over the last two decades. We believe these conditions bolster the case for diversifiers in a well-constructed portfolio.
Disclosures & Important Information
Any views expressed above represent the opinions of Mill Creek Capital Advisers ("MCCA") and are not intended as a forecast or guarantee of future results. This information is for educational purposes only. It is not intended to provide, and should not be relied upon for, particular investment advice. This publication has been prepared by MCCA. The publication is provided for information purposes only. The information contained in this publication has been obtained from sources that
MCCA believes to be reliable, but MCCA does not represent or warrant that it is accurate or complete. The views in this publication are those of MCCA and are subject to change, and MCCA has no obligation to update its opinions or the information in this publication. While MCCA has obtained information believed to be reliable, MCCA, nor any of their respective officers, partners, or employees accepts any liability whatsoever for any direct or consequential loss arising from any use of this publication or its contents.
© 2024 All rights reserved. Trademarks “Mill Creek,” “Mill Creek Capital” and “Mill Creek Capital Advisors” are the exclusive property of Mill Creek Capital Advisors, LLC, are registered in the U.S. Patent and Trademark Office, and may not be used without written permission.